How debuggers work:Part1 Basics学习笔记

How debuggers work: Part 1 - Basics学习笔记

Linux debugging - ptrace

《How debuggers work》写到ptrace是linux实现调试器中很重要的系统调用,以前在gdb调试报错的时候就能看到ptrace这个函数。

ptrace的man手册https://man7.org/linux/man-pages/man2/ptrace.2.html

ptrace的介绍

ptrace 提供了一种父进程可以控制子进程运行,并可以检查和改变它的核心image。它主要用于实现断点调试。一个被跟踪的进程运行中,直到发生一个信号。则进程被中止,并且通知其父进程。在进程中止的状态下,进程的内存空间可以被读写。父进程还可以使子进程继续执行,并选择是否是否忽略引起中止的信号。

ptrace的函数详解

函数原型

1
2
3
4
long ptrace(enum __ptrace_request request,
            pid_t pid,
            void *addr,
            void *data);
  • 参数request:请求ptrace执行的操作

  • 参数pid:目标进程的ID

  • 参数addr:目标进程的地址值

  • 参数data:作用则根据request的不同而变化,如果需要向目标进程中写入数据,data存放的是需要写入的数据;如果从目标进程中读数据,data将存放返回的数据

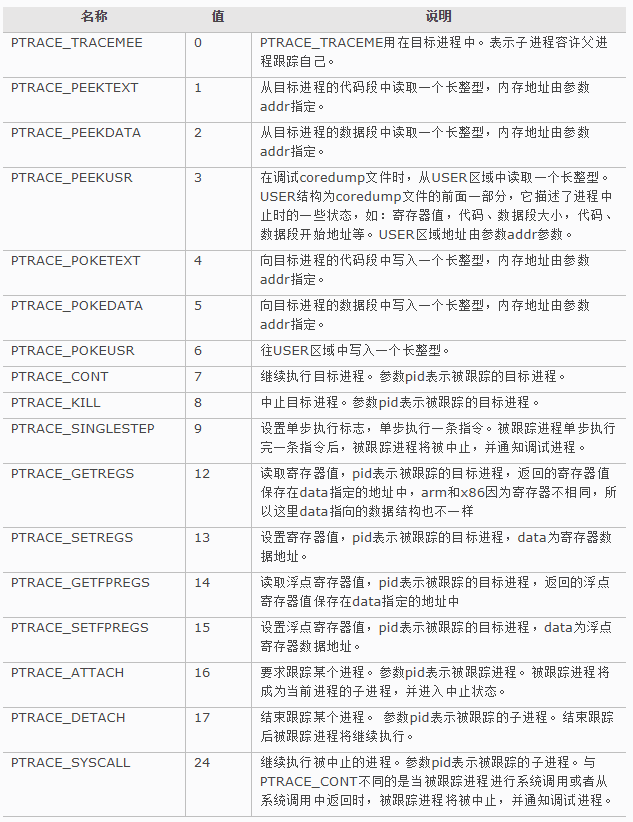
request参数决定了CODE的行为以及后续的参数是如何被使用的,参数request的常用的值如下:

img

示例说明

main函数

1
2
3
4
5
6
7
8
9
10
11
12
13
14
15
16
17
18
19
20
21
int main(int argc, char** argv)
{
    pid_t child_pid;

    if (argc < 2) {
        fprintf(stderr, "Expected a program name as argument\n");
        return -1;
    }

    child_pid = fork();
    if (child_pid == 0)
        run_target(argv[1]);
    else if (child_pid > 0)
        run_debugger(child_pid);
    else {
        perror("fork");
        return -1;
    }

    return 0;
}

run_target函数

1
2
3
4
5
6
7
8
9
10
11
12
13
void run_target(const char* programname)
{
    procmsg("target started. will run '%s'\n", programname);

    /* Allow tracing of this process */
    if (ptrace(PTRACE_TRACEME, 0, 0, 0) < 0) {
        perror("ptrace");
        return;
    }

    /* Replace this process's image with the given program */
    execl(programname, programname, 0);
}

这里的execl函数有点不懂,查了一下,文档上是这么写的“This, as the highlighted part explains, causes the OS kernel to stop the process just before it begins executing the program in execl and send a signal to the parent.”,应该是调execl函数会停止execl之前的进程,然后执行新的程序,进程空间被新的程序占有,并会向父进程发出信号。

exec函数说明

fork创建子进程后执行的是和父进程相同的程序(但有可能执行不同的代码分支),子进程往往要调用一种exec函数以执行另一个程序。当进程调用一种exec函数时,该进程的用户空间代码和数据完全被新程序替换,从新程序的启动例程开始执行。调用exec并不创建新进程,所以调用exec前后该进程的id并未改变。

其实有六种以exec开头的函数,统称exec函数:

1
2
3
4
5
6
7
8
#include <unistd.h>

int execl(const char *path, const char *arg, ...);
int execlp(const char *file, const char *arg, ...);
int execle(const char *path, const char *arg, ..., char *const envp[]);
int execv(const char *path, char *const argv[]);
int execvp(const char *file, char *const argv[]);
int execve(const char *path, char *const argv[], char *const envp[]);

这些函数如果调用成功则加载新的程序从启动代码开始执行,不再返回,如果调用出错则返回-1,所以exec函数只有出错的返回值而没有成功的返回值。

这些函数原型看起来很容易混,但只要掌握了规律就很好记。不带字母p(表示path)的exec函数第一个参数必须是程序的相对路径或绝对路径,例如"/bin/ls""./a.out",而不能是"ls""a.out"。对于带字母p的函数:

  • 如果参数中包含/,则将其视为路径名。
  • 否则视为不带路径的程序名,在PATH环境变量的目录列表中搜索这个程序。

带有字母l(表示list)的exec函数要求将新程序的每个命令行参数都当作一个参数传给它,命令行参数的个数是可变的,因此函数原型中有......中的最后一个可变参数应该是NULL,起sentinel的作用。对于带有字母v(表示vector)的函数,则应该先构造一个指向各参数的指针数组,然后将该数组的首地址当作参数传给它,数组中的最后一个指针也应该是NULL,就像main函数的argv参数或者环境变量表一样。

对于以e(表示environment)结尾的exec函数,可以把一份新的环境变量表传给它,其他exec函数仍使用当前的环境变量表执行新程序。

run_debugger函数

1
2
3
4
5
6
7
8
9
10
11
12
13
14
15
16
17
18
19
20
21
22
23
24
void run_debugger(pid_t child_pid)
{
    int wait_status;
    unsigned icounter = 0;
    procmsg("debugger started\n");

    /* Wait for child to stop on its first instruction */
    wait(&wait_status);
    
	/* WIFSTOPPED: 如果进程在被ptrace调用监控的时候被信号暂停/停止,返回True */
    while (WIFSTOPPED(wait_status)) {
        icounter++;
        /* Make the child execute another instruction */
        /* 这会告诉操作系统-请重新启动子进程,但在它执行下一条指令后停止它。*/ 
        if (ptrace(PTRACE_SINGLESTEP, child_pid, 0, 0) < 0) {       
            perror("ptrace");
            return;
        }
        /* Wait for child to stop on its next instruction */
        wait(&wait_status);
    }
	/* 一直循环单步走,直到程序退出,WIFEXITED会返回true */
    procmsg("the child executed %u instructions\n", icounter);
}

然后创建一个helloworld的C程序,然后用上面的程序运行它

1
2
3
4
5
6
7
#include <stdio.h>

int main()
{
    printf("Hello, world!\n");
    return 0;
}

实际上指令计数器icounter最后的结果高达1W多,主要是程序的初始化,还有printf是个很复杂的函数,导致实际的指令并非只有上面那几条。

新的run_debugger函数

1
2
3
4
5
6
7
8
9
10
11
12
13
14
15
16
17
18
19
20
21
22
23
24
25
26
27
28
29
30
void run_debugger(pid_t child_pid)
{
    int wait_status;
    unsigned icounter = 0;
    procmsg("debugger started\n");

    /* Wait for child to stop on its first instruction */
    wait(&wait_status);

    while (WIFSTOPPED(wait_status)) {
        icounter++;
        struct user_regs_struct regs;
        ptrace(PTRACE_GETREGS, child_pid, 0, &regs);
        unsigned instr = ptrace(PTRACE_PEEKTEXT, child_pid, regs.eip, 0);

        procmsg("icounter = %u.  EIP = 0x%08x.  instr = 0x%08x\n",
                    icounter, regs.eip, instr);

        /* Make the child execute another instruction */
        if (ptrace(PTRACE_SINGLESTEP, child_pid, 0, 0) < 0) {
            perror("ptrace");
            return;
        }

        /* Wait for child to stop on its next instruction */
        wait(&wait_status);
    }

    procmsg("the child executed %u instructions\n", icounter);
}

编译的时候一定要加-m32,不然会报错说没有eip

创建一个新的汇编程序

section    .text
    ; The _start symbol must be declared for the linker (ld)
    global _start

_start:

    ; Prepare arguments for the sys_write system call:
    ;   - eax: system call number (sys_write)
    ;   - ebx: file descriptor (stdout)
    ;   - ecx: pointer to string
    ;   - edx: string length
    mov    edx, len
    mov    ecx, msg
    mov    ebx, 1
    mov    eax, 4

    ; Execute the sys_write system call
    int    0x80

    ; Execute sys_exit
    mov    eax, 1
    int    0x80

section   .data
msg db    'Hello, world!', 0xa
len equ    $ - msg

上面的代码在我的机器一直编译不过去,查了一下gcc用的是AT&T的语法,下面是我改过的,其实还是有问题,但不妨碍理解

# asm.s
.code32
 .section   .data
msg:
    .ascii "Hello world!\n"
len:
    .long 13

 .section    .text
 .globl _start
_start:
    movl    len, %edx 
    movl    $msg, %ecx 
    movl    $1, %ebx
    movl    $4 , %eax
/* 这里学到一点
符号常数
符号常数直接引用 如
value: .long 0x12a3f2de
movl value , %ebx
指令执行的结果是将常数0x12a3f2de装入寄存器ebx。
引用符号地址在符号前加符号$, 如“movl $value, % ebx”则是将符号value的地址装入寄存器ebx。*/

    int    $0x80

    movl   $1, %eax
    int    $0x80

用as –32 asm.s -o asm.o,ld -m elf_i386 asm.o -o asm编译成32位程序

然后用新的run_debugger运行调试它

1
2
3
4
5
6
7
8
9
10
11
12
$ simple_tracer traced_helloworld
[5700] debugger started
[5701] target started. will run 'traced_helloworld'
[5700] icounter = 1.  EIP = 0x08048080.  instr = 0x00000eba
[5700] icounter = 2.  EIP = 0x08048085.  instr = 0x0490a0b9
[5700] icounter = 3.  EIP = 0x0804808a.  instr = 0x000001bb
[5700] icounter = 4.  EIP = 0x0804808f.  instr = 0x000004b8
[5700] icounter = 5.  EIP = 0x08048094.  instr = 0x01b880cd
Hello, world!
[5700] icounter = 6.  EIP = 0x08048096.  instr = 0x000001b8
[5700] icounter = 7.  EIP = 0x0804809b.  instr = 0x000080cd
[5700] the child executed 7 instructions

下面是我的结果

image-20210906151731026

image-20210906151755131

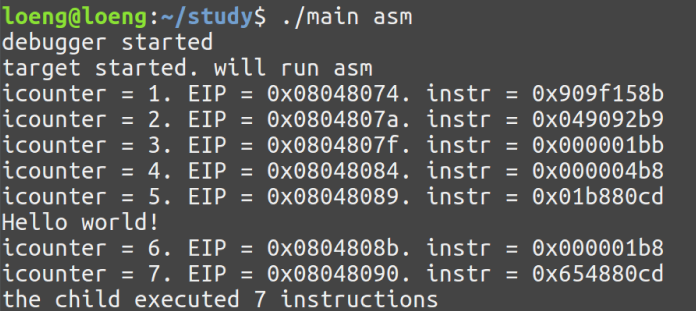
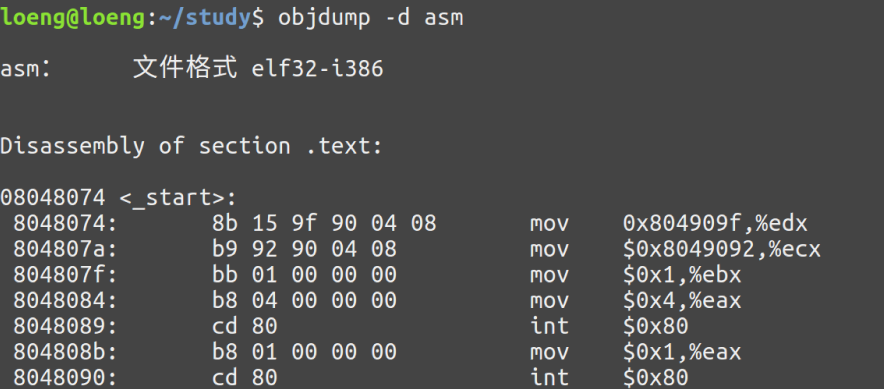
instr是EIP的操作符和操作数,可以用objdump -d对照上面的结果是否正确

1
2
3
4
5
6
7
8
9
10
11
12
13
14
15
$ objdump -d traced_helloworld

traced_helloworld:     file format elf32-i386


Disassembly of section .text:

08048080 <.text>:
 8048080:     ba 0e 00 00 00          mov    $0xe,%edx
 8048085:     b9 a0 90 04 08          mov    $0x80490a0,%ecx
 804808a:     bb 01 00 00 00          mov    $0x1,%ebx
 804808f:     b8 04 00 00 00          mov    $0x4,%eax
 8048094:     cd 80                   int    $0x80
 8048096:     b8 01 00 00 00          mov    $0x1,%eax
 804809b:     cd 80                   int    $0x80